Visually aligning on your what and why
OKRs can communicate WHAT you want to achieve. Causal chains can complement with WHY you believe your strategy will work.

OKRs are already at that growth stage spawning cottage industries of consultants, books, tools and certifications. A niche that exists but has not yet hit the explosive growth stage is the evolving tools for communicating your strategy or why which supports what you are aiming for with your OKRs.
There’s not a single dominant approach but the most common ways organisations address this (beyond the classic strategy slide packs) are with tools which while different all seem to share fairly common traits.
The traits are:
Predominantly visual
Feature outcomes (i.e. outcome-oriented goals)
Relationships between outcomes and other outcomes or relationships between outcomes and outputs or relationships between outcomes and measures or a combination of all of these.
As far as I can see - a lot of these evolved fairly independently but are evolving to address similar challenges.
Causal chains (our version)
As for my own experience - we started using the concept of causal chains - an idea that has existed in other fields for a long time and which has been applied in complex settings such as by NGOs in conflict zones or in looking at complex healthcare issues.
Essentially at each level, there’s an outcome described - you could draft an OKR from any of these - you could take the Causal Chain node as the O, the objective, and then define the KR, the Key Results which further help clarify its meaning and ensure everyone is on the same page.
Results Map
As OKRs as an informal framework don’t address the issue of communicating the clarity of logic behind goals being set we looked at more established frameworks such as PuMP. Surprise, surprise we found Stacey Barr had already a tool for this purpose. The Results Map. It was essentially a way for an organisation to explore and communicate many causal chains and to select a subset to be the organisation’s next tactical focus. Essentially a communication of an organisation’s opportunities and strategy on a page.
Bet boards & North Star Metrics
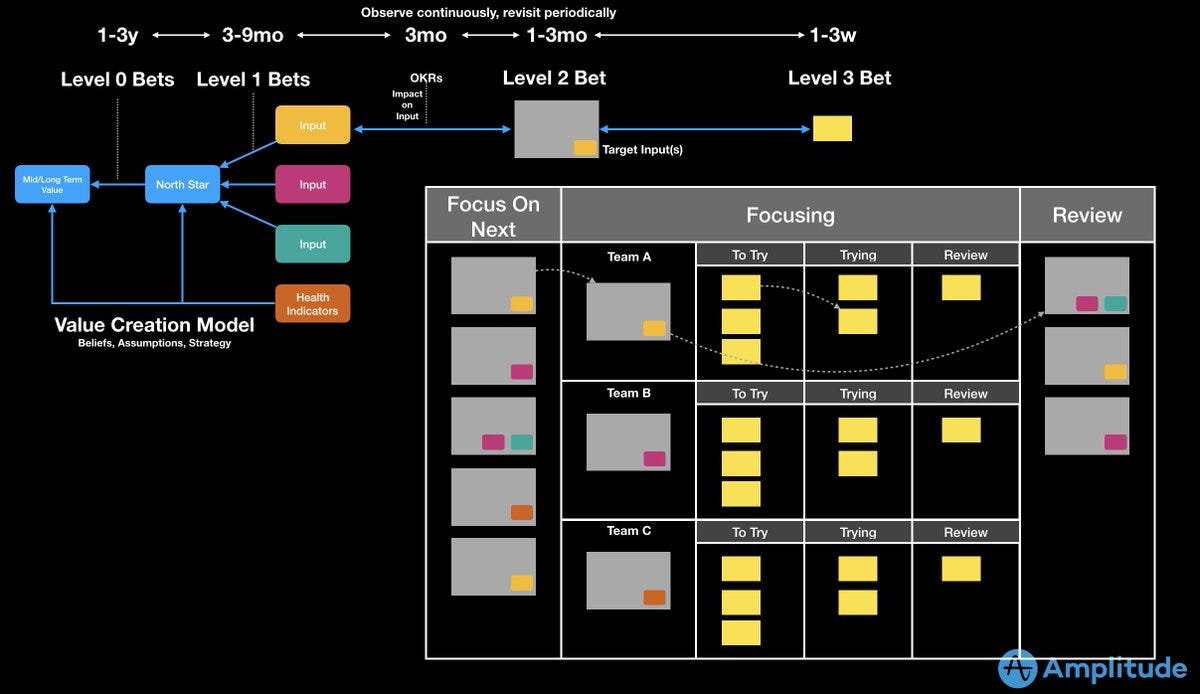
Amplitude and John Cutler share the concept of a bet board and the idea of bets which influence a North Star metric. Different scales of bets map to different time windows. The strategy of what is believed may influence the North Star metric. The North Star metric is a derived metric that reflects the core function of the business improving feature as bets and the relationship to the North Star is shown.
Opportunity Solution Trees
Teresa Torres and Hope Gurion share the following tool, Opportunity Solution Trees in their training, books and publications:
Opportunity Solution Trees focus generally on one outcome and all the opportunities and the relationships between those opportunities through to the relationships with potential solutions and potential experiments.
Current Reality Trees and Future Reality Trees
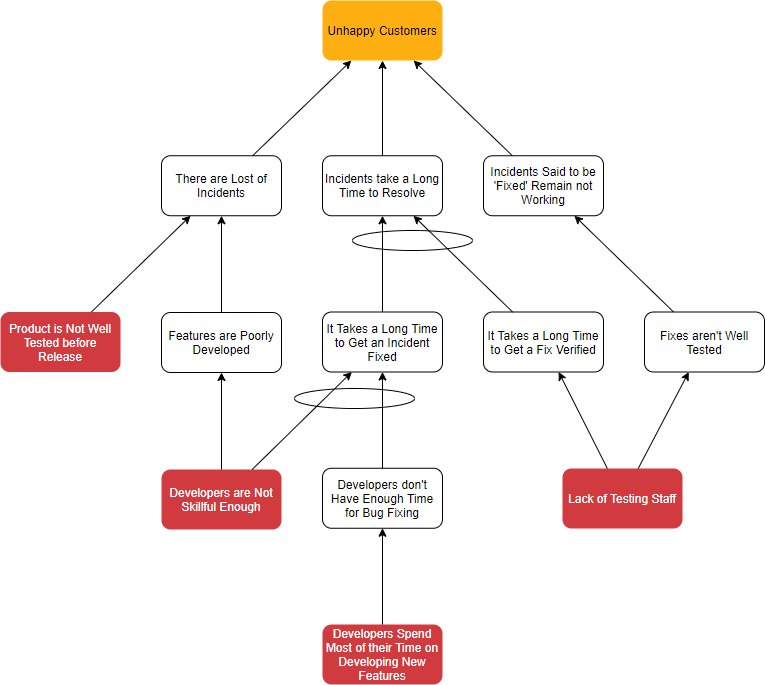
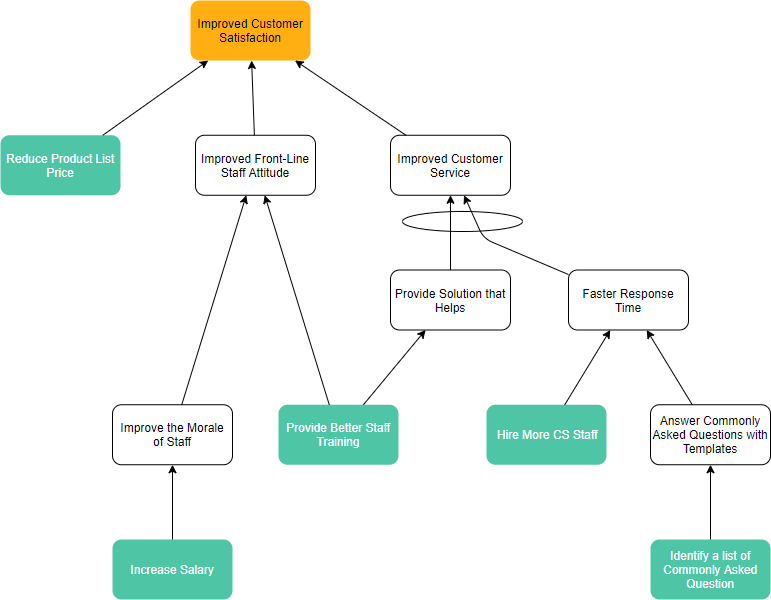
Influential in some of our thinking is using and adapting tools such as Causal Chains and Results Maps were influenced by the Current Reality and Future Reality Trees from Eli Goldratt’s Theory of Constraints. The evaporating cloud diagram, prerequisite tree and transition trees are other related tools applying similar concepts.
I noticed practitioners of these tools often asked themselves of each node sitting under an existing node (which in this case would be a higher level outcome) - “What needs to be true for the above outcome to be true?” - an approach I’ve used to help to draft Causal Chains and Results Maps rapidly.
In a future post, I will cover other examples which evolved from here where we used elements from a number of these approaches to further aid clarity in people consuming these diagrams as a visual articulation of strategy. Share in the comments if you are using one of these approaches for the same purpose or any different ways you approach ensuring there’s the maximum clarity possible on what is to be achieved and why.


Thanks, nice little catalogue of similar approach all trying to undcover what really needs to be done to progress against a goal. I've noticed over the years that the same idea crops up again and again in different language and descriptions, like the goal itself: goal, mission, mission statement, purpose, North Star, True North, BHAG, MTP.
In execution you want lots and lots of small pieces: but in deciding what to those pieces add up to you must run to the opposite extreme, get big (meaningful and devoid of action) and work back to action and lots of little pieces